
Are Solar Panels Worth It? A 2026 Reality Check Without the Tax Credit
Are solar panels worth it in 2026 now the 30% tax credit is gone? See real payback math by state, the export credit effect and when solar doesn't pay.
How much do solar panels cost in 2026? Real installed prices per watt from Berkeley Lab, costs by system size, battery add-ons, and why no federal credit now.
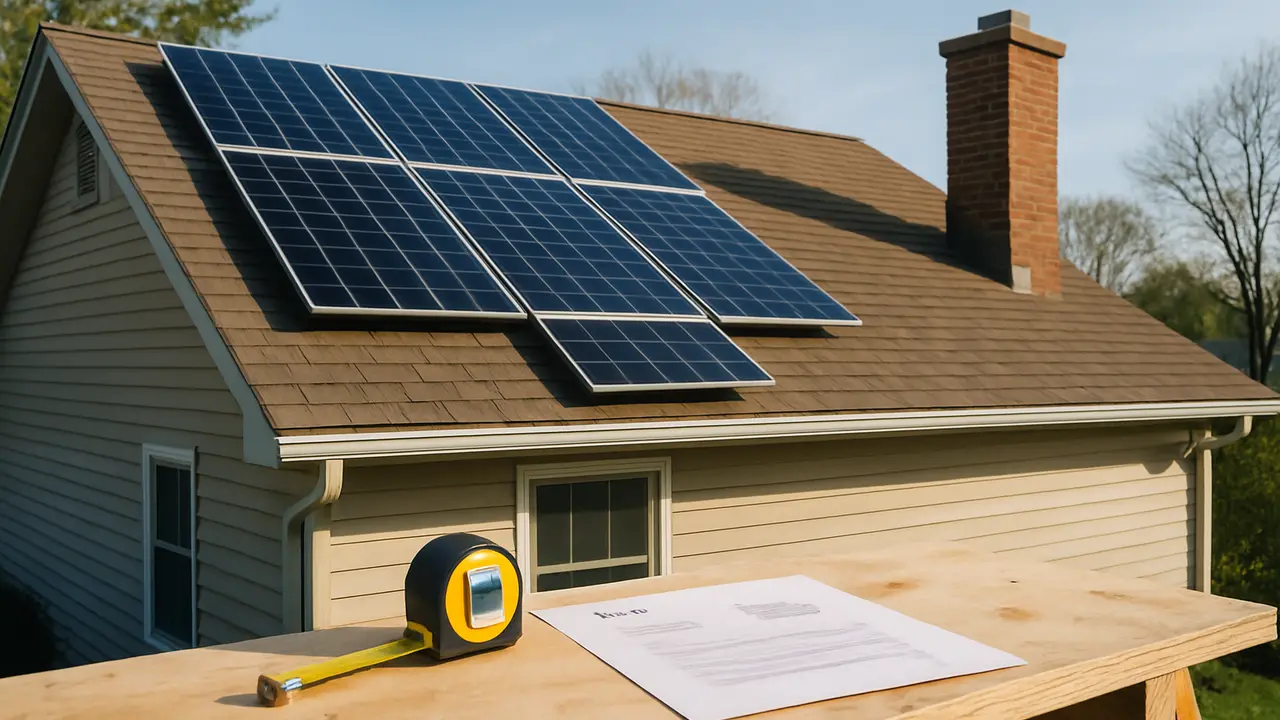
How much do solar panels cost? For a typical US home in 2026, expect roughly $23,000 to $28,000 before incentives for a 7.7 kW system, based on Berkeley Lab's latest median prices of $3.0 per watt (cash) to $3.6 per watt (all homeowner-owned systems). Loans, batteries, roof work and local markets can push the total higher.
Those figures come from the most detailed public price data in the country: Lawrence Berkeley National Laboratory's Tracking the Sun (opens in a new tab) 2026 data update, published in August 2026. It covers about 450,000 systems installed in 2025, or 93% of the US market. Below we turn those medians into dollar amounts for common system sizes, explain what moves a quote up or down, and show what a battery adds.
The national median installed price for homeowner-owned residential solar installed in 2025 was $3.6 per watt, according to Berkeley Lab's August 2026 update. Known cash purchases had a median of $3.0 per watt, and loan-financed systems $4.5 per watt. These are prices before any incentives, in 2025 dollars.
Price per watt is the fairest way to compare quotes, because it removes the effect of system size. You divide the total price by the system's size in watts (DC). A $21,000 quote for a 7 kW (7,000-watt) system is $3.00 per watt.
| Purchase type (2025 installs) | Median installed price | Change from 2024 (real) |
|---|---|---|
| All homeowner-owned systems | $3.6/W | down from $4.1/W |
| Known cash purchases | $3.0/W | down from $3.6/W |
| Known loan-financed | $4.5/W | down from $4.8/W |
| Solar plus battery, all homeowner-owned (per watt of solar) | $4.9/W | not reported |
Source: Lawrence Berkeley National Laboratory, U.S. Distributed Solar and Storage: 2026 Data Update, August 2026. Leases and PPAs are excluded because the homeowner doesn't pay an up-front price.
| Purchase type | 2024 installs ($/W, real) | 2025 installs ($/W) |
|---|---|---|
| All homeowner-owned | $4.10 | $3.60 |
| Cash | $3.60 | $3.00 |
| Loan-financed | $4.80 | $4.50 |
Source: Lawrence Berkeley National Laboratory, U.S. Distributed Solar and Storage: 2026 Data Update (as of 2026-10)
Prices also spread widely around those medians. Berkeley Lab found the median prices of the 100 largest residential installers ranged from $2.4 to $6.3 per watt in 2025. Almost 25% of them had medians under $3 per watt, while about 10% had medians above $5. Two quotes for the same house can easily differ by several thousand dollars.
Multiply the system size in watts by the price per watt. At the 2025 medians, a 6 kW system runs about $18,000 to $21,600, a 7.7 kW system about $23,100 to $27,700, and a 10 kW system about $30,000 to $36,000 before incentives. Loan prices with fees built in can be higher.
The table below applies the three Berkeley Lab medians to common sizes. The median US residential system installed in 2025 was 7.7 kW, and most fell between roughly 5 and 12 kW.
| System size | Cash median ($3.0/W) | All homeowner-owned ($3.6/W) | Loan median ($4.5/W) |
|---|---|---|---|
| 4 kW | $12,000 | $14,400 | $18,000 |
| 6 kW | $18,000 | $21,600 | $27,000 |
| 7.7 kW (2025 median size) | $23,100 | $27,720 | $34,650 |
| 10 kW | $30,000 | $36,000 | $45,000 |
| 12 kW | $36,000 | $43,200 | $54,000 |
Figures are system size × median price per watt, before rebates. They are not quotes. Use them as a reasonableness check.
Not sure which row is yours? Start with your yearly electricity use. Our solar panel sizing calculator turns a monthly bill into a system size and panel count, and the roof fit calculator checks how many panels your roof can actually hold. If you plan to buy an electric car, the EV solar calculator shows how much extra capacity charging would need.
Most of the price is not the panels. Berkeley Lab estimates that soft costs and other non-module, non-inverter costs make up roughly 80% of the installed price of residential systems in 2025. Sales costs, labor, permitting, financing fees, overhead and profit are where quotes differ most.
Soft costs include customer acquisition (advertising and sales commissions), design, labor, permits and inspections, interconnection, taxes and profit. Berkeley Lab notes that since 2014, installed prices have fallen only about $0.1 to $0.2 per watt per year on average, driven mostly by changes in these costs rather than hardware. An installer with a lean sales process can often charge less for the same equipment.
Berkeley Lab found loan-financed systems "considerably higher priced" than cash purchases, potentially because loan origination fees are rolled into the up-front price. The Consumer Financial Protection Bureau reported in 2024 (opens in a new tab) that these hidden dealer fees often increase the cost of a solar loan by 30% or more. Our guide to how solar loans work shows how to spot the fee.
Among states with at least 20 data points, median 2025 residential prices ranged from about $3.0 per watt in Washington to $4.1 per watt in New Mexico and North Carolina. Some sunny-state medians from the same chart: Arizona and Florida about $3.1, California about $3.3, Massachusetts about $3.4, and Texas about $4.0 per watt.
| Median $/W | |
|---|---|
| Washington | $3.00 |
| Arizona | $3.10 |
| Florida | $3.10 |
| California | $3.30 |
| Massachusetts | $3.40 |
| Texas | $4.00 |
| New Mexico | $4.10 |
| North Carolina | $4.10 |
Source: Lawrence Berkeley National Laboratory, U.S. Distributed Solar and Storage: 2026 Data Update (as of 2026-10)
These factors add cost that a per-watt average can't show:
A battery is the biggest optional add-on. In Berkeley Lab's 2025 data, solar-plus-storage systems bought with cash had a median price $2.1 per watt of solar higher than solar alone. On a 7.7 kW system, that works out to about $16,000 more, for a typical 13.5 kWh battery.
Batteries are now common. Berkeley Lab reports that 37% of new residential solar systems in 2025 were paired with storage, up from 25% in 2024, with California and Hawaii having the highest attachment rates and large increases in Arizona and Texas. The median residential battery paired with solar was 13.5 kWh.
up from 25% in 2024
per watt of solar
Source: Lawrence Berkeley National Laboratory, U.S. Distributed Solar and Storage: 2026 Data Update (as of 2026-10)
| Configuration (2025 cash purchases) | Median per watt of solar | 7.7 kW example |
|---|---|---|
| Solar only | $3.0/W | $23,100 |
| Solar plus battery | $5.1/W | $39,270 |
| Difference (implied battery cost) | $2.1/W | about $16,170 |
About 80% of the paired-system price data came from California, so treat the battery figure as a guide, not a national rule. Whether a battery pays off depends on your utility's rates and export rules. In California, where exports earn far less than retail under the Net Billing Tariff, a battery is often central to the savings; read whether solar batteries are worth it before you add one for savings alone.
No, not for a system you buy and own that is installed in 2026. As of October 2026, the 30% Residential Clean Energy Credit (section 25D) ended for expenditures made after December 31, 2025, under Public Law 119-21. The IRS treats the expenditure as made when installation is completed, not when you pay.
That rule comes straight from the IRS's FAQ on the 2025 law changes (opens in a new tab) (FS-2025-05, August 21, 2025): paying for a system in 2025 doesn't qualify if installation finished in 2026. The IRS's Residential Clean Energy Credit page (opens in a new tab) now says the credit is not available for property placed in service after December 31, 2025.
What's left are state, local and utility incentives, which vary a lot. Our overview of solar incentives by state is the place to look for rebates, property tax exemptions and export credit rules that can still reduce your net cost.
Paying cash has the lowest price per watt, based on the 2025 medians ($3.0 per watt cash versus $4.5 for loans). A lease or PPA has no up-front price at all, but you pay a monthly charge for 20 to 25 years and don't own the system. The cheapest choice depends on your cash, credit and how long you'll stay.
Here is what each option means for "cost":
The solar lease vs PPA vs loan guide compares these over 25 years. The Federal Trade Commission's solar guide for homeowners (opens in a new tab) also recommends getting several quotes and reading the financing terms before signing.
A fair quote is in a sensible price-per-watt range for your state, lists specific equipment and warranties, and shows a cash price you can compare. Getting three quotes is the single best way to judge one. Berkeley Lab's data show prices for the same type of job routinely differ by $1 to $2 per watt.
Say you receive two quotes:
Quote B is $4,500 more in total but only $0.36 per watt more, and it is 600 watts bigger. Using a national-average output of 1,350 kWh per kW per year and 0.5% yearly panel degradation, Quote A works out to about 9.4 cents per kWh over 25 years. If Quote B uses better panels or a stronger workmanship warranty, the gap may be worth it.
For a full checklist of what to ask, see how to choose a solar installer. Once you have a realistic price, the next question is whether the savings justify it; our solar payback guide runs the numbers for several states, and the solar panel cost calculator lets you test your own price, size and battery choices.
Installed prices have fallen a lot over two decades, but slowly in recent years. Berkeley Lab reports that residential prices have dropped $9 to $11 per watt in real terms over about 20 years, a 70% to 80% decline. Since 2014, the drop has averaged only $0.1 to $0.2 per watt per year.
The 2025 data showed a larger one-year move: a $0.5 per watt real decline for homeowner-owned residential systems, with bigger drops for cash purchases. Nobody can promise that continues. Equipment prices, trade policy and installer business models all shift, so the safest approach is to price your own project with current quotes rather than waiting for a lower number.
Electricity prices matter too, because they decide how fast the system pays back. The US Energy Information Administration's Electric Power Monthly (opens in a new tab) puts the average US residential price at 18.19 cents per kWh for January through July 2026, up from 17.01 cents in the same months of 2025. The higher your rate, the more each solar kWh is worth.
About $21,000 to $25,200 before incentives at $3.0 to $3.6 per watt, the 2025 medians Berkeley Lab reported for cash and all homeowner-owned systems. If the system is financed with a loan that carries fees, the price is often higher; the 2025 median for loan-financed systems was $4.5 per watt, or $31,500 for 7 kW. Local quotes vary widely, so compare at least three.
A cash quote near or below about $3.0 per watt is in line with the 2025 national median for cash purchases. Berkeley Lab found that almost 25% of the 100 largest installers had median prices under $3 per watt, while about 10% had medians above $5. Use price per watt to compare quotes of different sizes, then check equipment and warranties.
Not for a system you own that was installed in 2026. As of October 2026, the Residential Clean Energy Credit ended for expenditures made after December 31, 2025, and the IRS treats an expenditure as made when installation is completed. Systems completed in 2025 are claimed on the 2025 tax return.
Berkeley Lab found that paired solar-plus-storage systems bought with cash had a median price $2.1 per watt of solar higher than solar alone in 2025. On a 7.7 kW system that difference is about $16,000. The typical residential battery in that data was 13.5 kWh.
Lenders often charge the installer a dealer fee to offer a low advertised rate, and that fee is built into the system price. Berkeley Lab's 2025 data showed median loan-financed prices of $4.5 per watt versus $3.0 for cash, and the CFPB has reported that these fees can add 30% or more to the cost. Always ask for the cash price in writing.
Yes. Among states with enough 2025 data, Berkeley Lab's median residential prices ran from about $3.0 per watt in Washington to $4.1 per watt in New Mexico and North Carolina. Market size, permitting, financing mix and local competition all play a part.
Sometimes, but not reliably for homes. Berkeley Lab noted that economies of scale were not especially evident among residential systems installed in 2025, even though fixed costs like permits and design are spread over more panels on larger systems. Compare price per watt rather than assuming a bigger system is a better deal.
The installed price normally covers panels, inverters, racking, wiring, labor, permits, interconnection paperwork, the installer's sales costs and profit. Berkeley Lab estimates these soft costs and other non-panel costs make up roughly 80% of the installed price. Roof repairs, main panel upgrades and batteries are often extra.

Are solar panels worth it in 2026 now the 30% tax credit is gone? See real payback math by state, the export credit effect and when solar doesn't pay.

Federal solar tax credit 2026: 25D ended for systems finished after 2025. See who can still claim, carryforwards, leases, PPAs and state credits.
How to choose a solar installer in 2026: check licenses and NABCEP certification, compare quotes per watt, read warranties and spot pressure tactics.
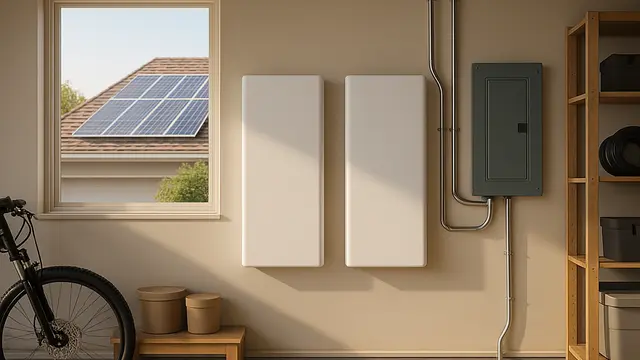
Are solar batteries worth it? See 2026 battery costs, when time-of-use savings and backup pay off, and why the answer differs in CA, AZ and TX.